Appearance
Analytics
Analytics provides usage statistics for your tenant.
Messages tab
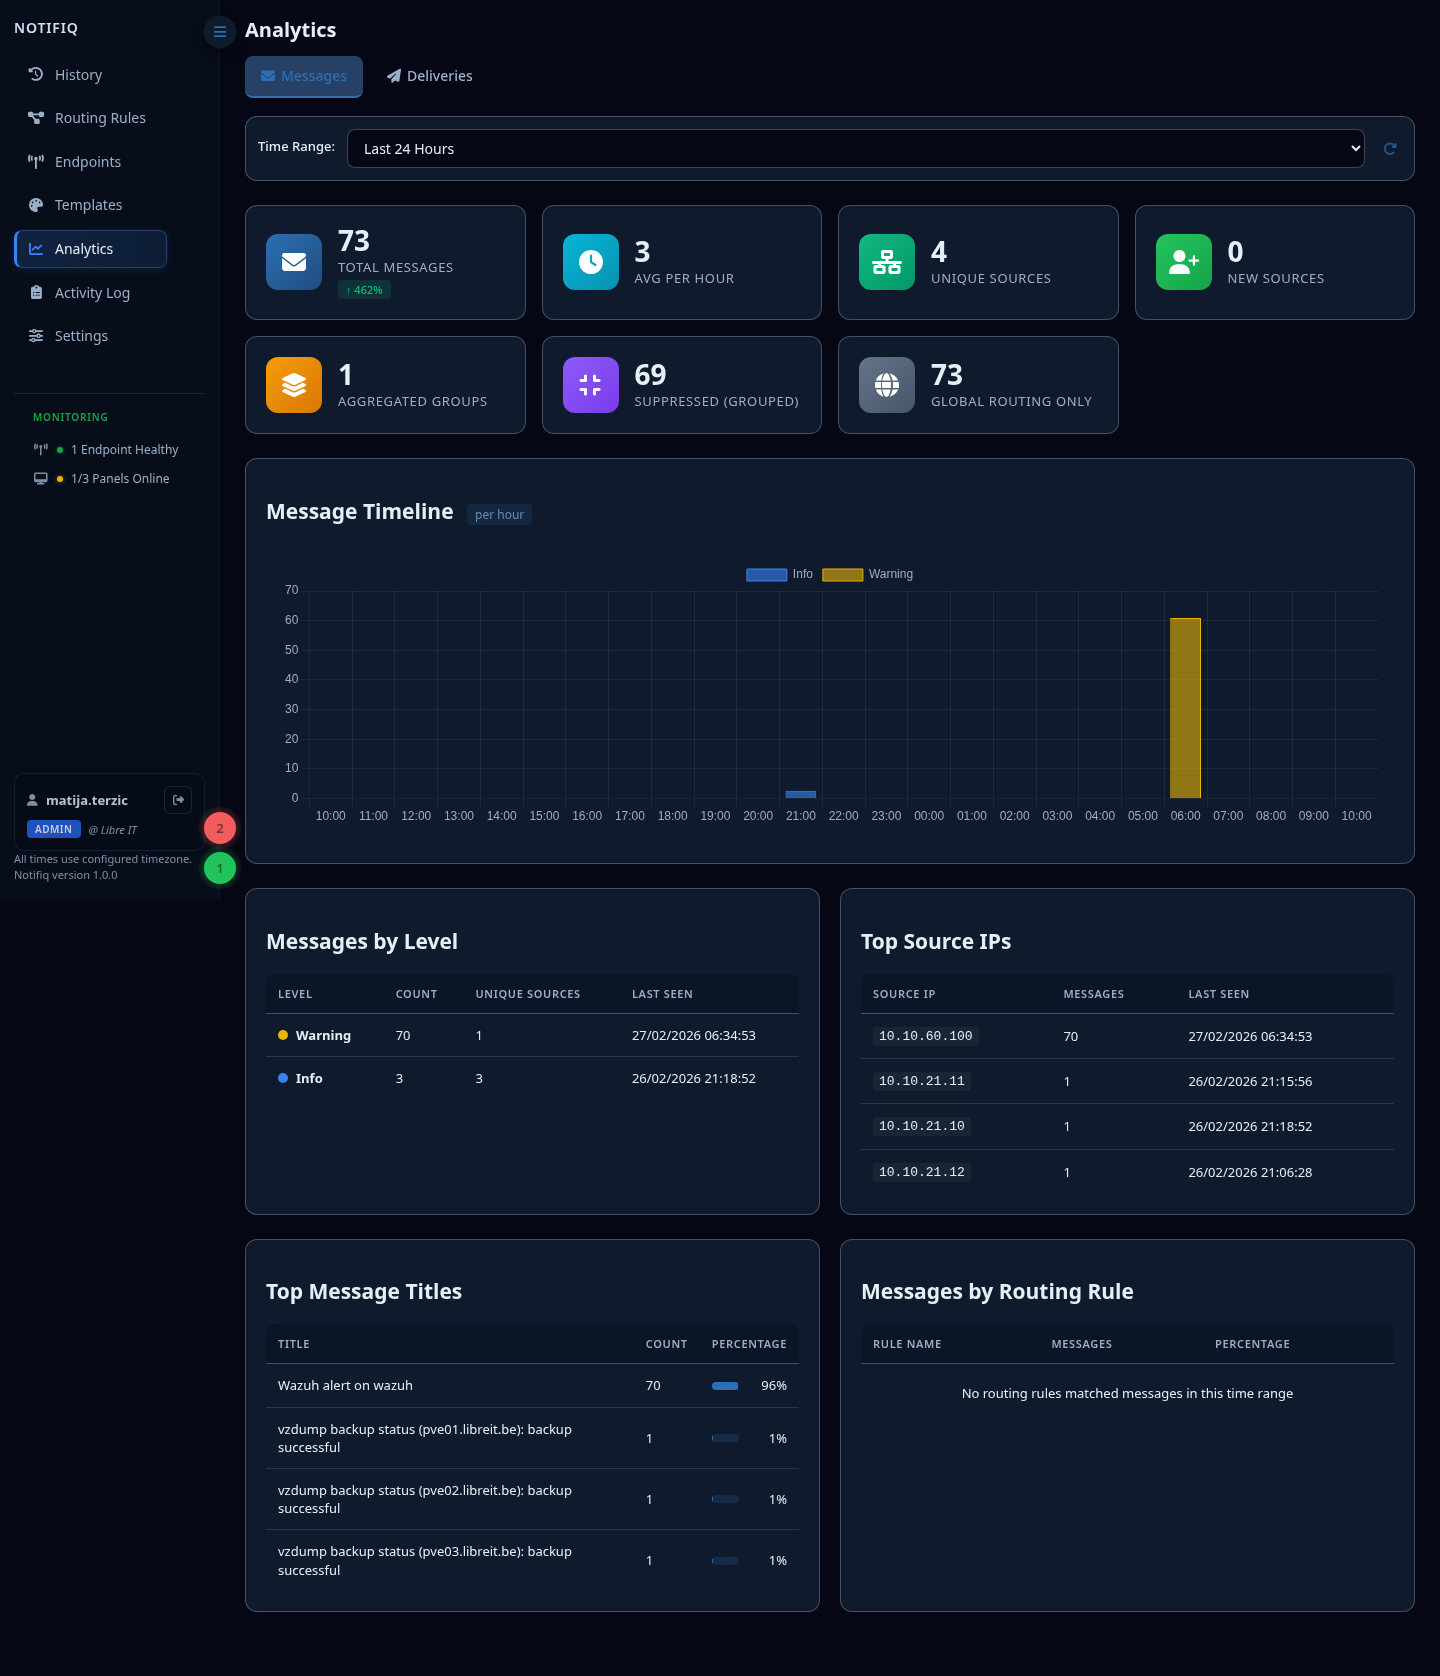
Tracks incoming message volume over time:
- Total messages received
- Breakdown by level (critical, error, warning, info, success)
- Messages per source system
- Volume chart (hourly / daily)
Use this to identify noisy sources, detect alert storms, or verify that monitoring systems are sending data.
Deliveries tab
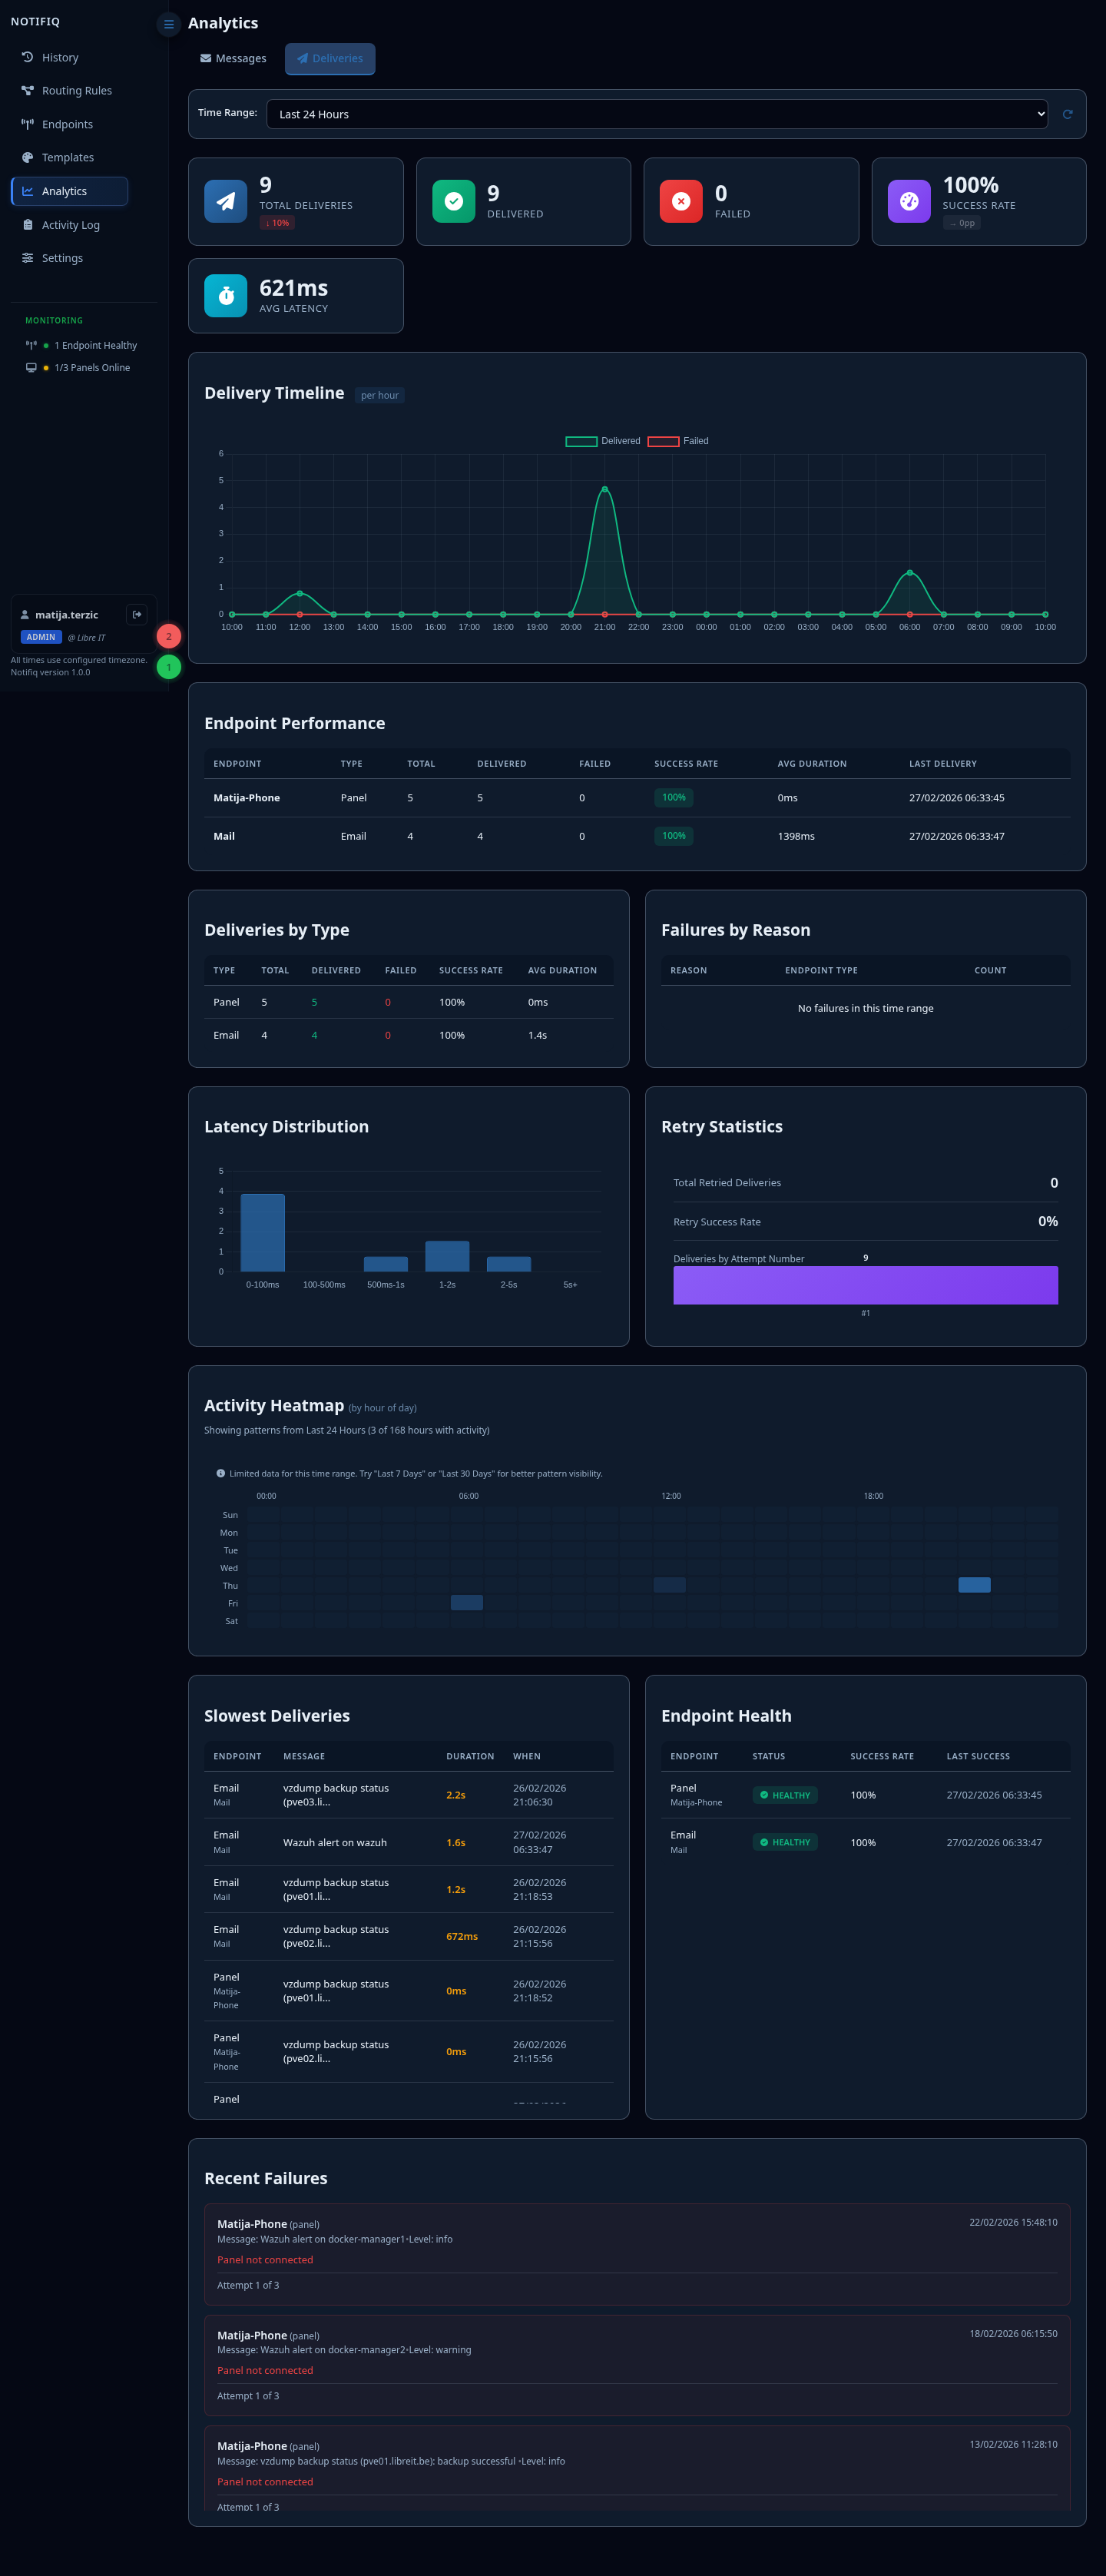
Tracks outbound delivery performance:
- Total delivery attempts
- Success / failure breakdown per endpoint
- Delivery latency
- Failed deliveries (with reason)
Use this to spot broken endpoints, SMTP configuration issues, or Telegram bot problems.
Prometheus metrics
If you need raw metrics for Grafana or another observability stack, Notifiq exposes a /metrics endpoint compatible with Prometheus.
A pre-built Grafana dashboard is included in the repository as grafana-dashboard.json.